 Logicbroker Reporting
By Logicbroker | December 3, 2020
According to Gartner, 49% of brands and retailers employ drop ship as a key component of their omnichannel strategy. For both parties there are multiple partners to manage, and having visibility to monitor performance, errors, and overall GMV is business critical. Within the Logicbroker portal, our retailer and brand/supplier customers enjoy out-of-the-box reporting functionality to monitor documents and review charts that can be filtered, moved and resized on the dashboard according to individual preferences.
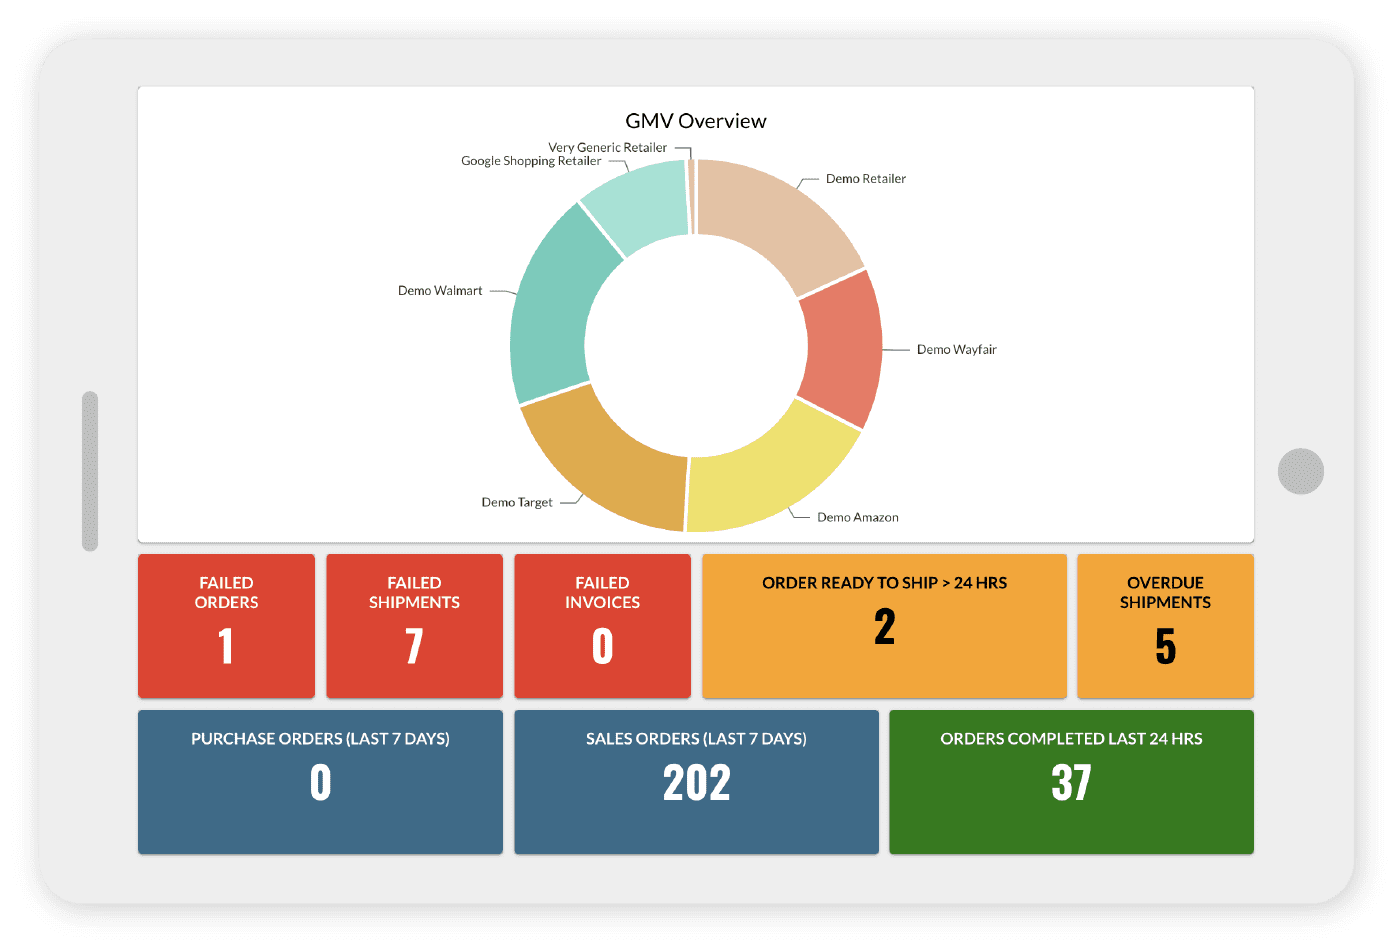
By default, all users have a preset view of charts and reports including a bar chart of order count, a GMV donut and a list of common counts for monitoring your data. You can edit the default or create your own new reports and charts. If necessary, the option to restore to default settings is available as well.
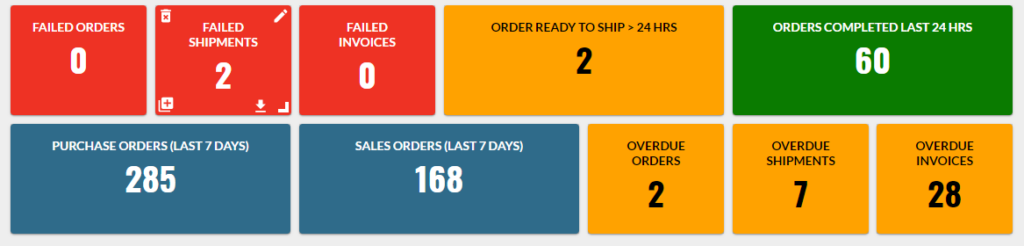
Additionally, users can view report tiles on the main report dashboard. These tiles can be configured to show document counts based upon filtered conditions. New tiles can be created and added by clicking upon ‘New Report.’ While we have proactive monitoring and notifications, the report tiles are another way to stay on top of failed documents or overdue items – helping to maintain compliance for both supplier and their retail channels and for retailers to ensure timely fulfillment and avoid a negative customer experience. Beyond the aforementioned filters, tiles may also be configured to display the following:
| Value | Description |
| Document Type | Available options include Order, Acknowledgement, Shipment, Invoice and Return. |
| Status | This is the status description; all available options can be found here. Typical order statuses include Ready to Acknowledge, Ready to Ship, Ready to Invoice, and Complete. |
| Status Code | This is the code associated with the status; all codes can be found here. Typical order status codes 150 (Ready to Acknowledge), 500 (Ready to Ship), 600 (Ready to Invoice). |
| Sender | This is the sender Company ID. Your partner’s Company ID can be found by navigating to the Suppliers or Retailers page. |
| Receiver | This is the receiver’s Company ID. Your partner’s Company ID can be found by navigating to the Suppliers or Retailers page. |
| Date | Date of the document. |
| Status Change Date | Date the status was last changed for that document. |
| System | System of how the document was received. This includes Portal, Workflow, Custom XML, CSV, External API, EDI, and other system names. For a list of all systems see our Channel and System Integrations section. |
Users can add as many filters as they wish, and all filters conditions use an “AND” condition; therefore, the documents in the report will only count if they meet all the conditions setup. When a tile is added to the reporting dashboard, the view can be set to filter, delete, copy, edit or download a CSV/XLSX export of all the documents counted in the report. In addition, by clicking the number you will be taken to a filtered page with a complete list of all the documents.
Beyond the default charts on the main dashboard, the data display can be customized to depict order counts, quantity and GMV as either line, bar or pie charts that can additionally be configured with a time interval to provide a visual picture of your data. Below is the full list of available values:
| Value | Description |
| New Count | # of documents that have been received based on the time interval set. |
| Failure Count | # of documents that have failed based on the time interval set. |
| Complete Count | # of documents completed based on the time interval set. That is documents that have been full shipped and/or invoiced. |
| Duplicate Count | # of documents that have been marked as duplicate in the time interval set. |
| Total Amount | Aggregated Invoice total $ amount provided on all invoices given the interval set. |
| Subtotal | Aggregated (Quantity * Price) for all line items provided on your orders given the interval set. |
| Total Quantity | Aggregated Quantity for all orders given the interval set. |
Once the value is added, the following filters can be utilized:
| Value | Description |
| Document Type | Order, Acknowledgement, Shipment, Invoice, and Return |
| Sender | This is the sender Company ID. Your partner’s Company ID can be found by navigating to the Suppliers or Retailers page |
| Receiver | This is the receiver’s Company ID. Your partner’s Company ID can be found by navigating to the Suppliers or Retailers page |
Note – all reports created are saved on the user level but can be shared externally by exporting the report configuration for colleagues to then import. The ability to share data keeps relevant parties on the same page – and minimizes the likelihood of any misses.
Additionally, Logicbroker customers have the option to upgrade to the Advanced Reporting suite which provides full business intelligence tools to analyze data. Specifically, Advanced Reporting includes vendor compliance reporting, year-over-year (YoY) comparisons, and extends Logicbroker Data with other data sources. To learn more about Advanced Reporting, see here or contact us.
Paired with our proactive monitoring notifications, Logicbroker’s native suite of reporting tools provide key insights into overall performance. Report tiles, in particular, enable limitless customizations around performance, failed docs, and overdue orders and filter by partner. Making data-driven decisions is crucial, as online sales continue to soar and customer demands increase. Logicbroker delivers the tools necessary to monitor performance to ensure steady growth.
Modern dropship & marketplace solutions have never been so easy.
Are you ready to drive growth and gain unparalleled speed to market with a modern, scalable dropship or marketplace program? Fill out the form below to get in touch with our team: